
Coastal Erosion
Tuktoyaktuk's west shore is retreating by an average of 0.3 to 3 meters per year, and during large storms can retreat by up to 5 meters over a few days. At this pace, the northern-most area of the community will be inaccessible by road by the year 2050.
Erosion mechanisms
Erosion on permafrost coasts is both thermal (thawing frozen ground releases the sediments) and mechanical (wave action physically removing the sediments from the shore) [1],[2]. Ice-rich sediments are subject to relatively rapid erosion; quick-thawing ice adds water and makes it easier for the sediments to move downslope, and only a portion of the volume eroded from the coast goes onto the beach or nearshore sediment budget (the ice portion becomes water).
There are three main types of shoreline erosion in Tuktoyaktuk: longshore transport, offshore transport, and thermal action [3].
Longshore transport - Waves arriving at an angle to the shore gradually move sediments along the length of the coast.
Sediments moving down the shore can accumulate and form spits, which can tell us about the primary drift direction. Tuktoyaktuk has gravel spits at the north and south of the peninsula, telling us that sometimes currents move towards the north, and sometimes they move towards the south.
Offshore transport - The rapid removal of sediments away from the coast due to changing water levels and wave conditions during storms.
Thermal action - Gradual consolidation and transportation of sediments by the outflow of melted ice.
![Gravel spits to the north and south of the peninsula and at the island's east end are indicators of sediment drift direction. (Imagery: NRCan [4]; inset: USGS [5]).](https://images.squarespace-cdn.com/content/v1/60f0936c2784dd48ebe620d4/1629057232719-URJ8OARTHAQ0GYI8C8S0/JPEG+image.jpeg)
When waves arrive at an angle to the shore, they gradually push sand and gravel down the coast. Gravel spits to the north and south of the peninsula and at Tuk Island's east end are indicators of sediment drift direction. (Imagery: NRCan [4]; inset: USGS [5]).

Thawing ground ice (as can be seen in the bluff face) releases water and mobilizes sediments.(Photo: B. Berry, June 2019. Richard's Island, NWT).
Measuring erosion
Erosion is usually described as a rate of change in meters per year. Knowing the annual average shoreline retreat is useful to determine the long-term safety of a building or road, and to see if the speed of erosion has changed over time.
Aerial photographs can be used to determine the shoreline position at a given time. To measure shoreline change, first we take photos from several years and trace the shoreline on each one. The shorelines are all put together in the same map, in order to measure the distance it moved from one year to the next.

Aerial images of Tuktoyaktuk in 1964 and 2010, with shoreline positions showing the receding coastline between 1950 and 2018. (Images provided by NRCan)

To measure the rate of change, we measure the distance between shorelines, and then divide by the length of time between them. These measurements are taken at many places along the coast, in order to see both how fast erosion is happening and where it is the most extreme.
Past and recent shoreline erosion rates
In the past, aerial photos were only taken every several years, so the measured rates of erosion are averages over long periods of time. In recent years, it has become easier to take aerial photos with small unmanned aerial vehicles (UAVs, or drones), so we have a better idea of the amount of erosion occurring in a single year.
![Long-term average annual recession rates along Tuktoyaktuk's west shoreline and Tuk Island [6]. (2010 imagery [4]).](https://images.squarespace-cdn.com/content/v1/60f0936c2784dd48ebe620d4/1629061849899-RQE6QBUOFM20063BU93E/Four+graphs+of+average+recession+rate+through+time%2C+next+to+a+map+of+the+sectors+that+were+measured.+The+highest+average+rates+of+retreat+in+the+last+two+decades+are+seen+at+Tuk+Island%2C+while+the+lowest+rates+are+seen+in+the+northern+sector+of+the+community.)
These graphs show the change in annual recession rates between 1950 and today in four sectors along Tuktoyaktuk’s west shoreline and Tuk Island [6]. The highest average rates of retreat in the last two decades are seen at Tuk Island, while the lowest rates are seen in the northern sector of the community. (2010 imagery [4])
Between 1950 and 1970, the average annual recession rate along Tuktoyaktuk’s west shoreline were between 0.6 meters per year (north of the cemetery) and 3 meters per year (along the gravel beach south of Pokiak Lake) [6]. Engineering consulting reports from 1972 to 1994 used a generalized average rate of 1.8 meters per year for the west shore to estimate future shoreline locations and identify infrastructure most at-risk [7,8]. Based on these average annual erosion rates, UMA Engineering Ltd. concluded in 1994 that the peninsula would be inaccessible by road by the year 2040, if no action was taken to protect the shoreline.
Since 1970-1985, slower rates of shoreline erosion have been observed at Tuk Island and on the community’s shoreline from Flagpole Point to the southern reach of Pokiak Lake. In some sectors, shoreline protection structures have slowed erosion. A period of reduced storminess from 1996 to 2015 likely also contributed to the slower erosion rates seen even in unprotected areas [6]. The gravel beaches along Pokiak Lake and the spit to the south are capable of both erosion and accretion, unlike the purely eroding banks to the north and along Tuk Island [6].
The average rates give a general idea of the magnitude of erosion around the community. However, erosion in Tuktoyaktuk usually isn't a slow, continuous process - most shoreline retreat occurs during storm events, with periods of relative stability in between. Single storm events have been known to produce up to 7 meters of shoreline retreat in areas where ground ice is exposed [8]. More often, however, storms cause shoreline retreat on the order of 3 meters in the span of two or three days [3].
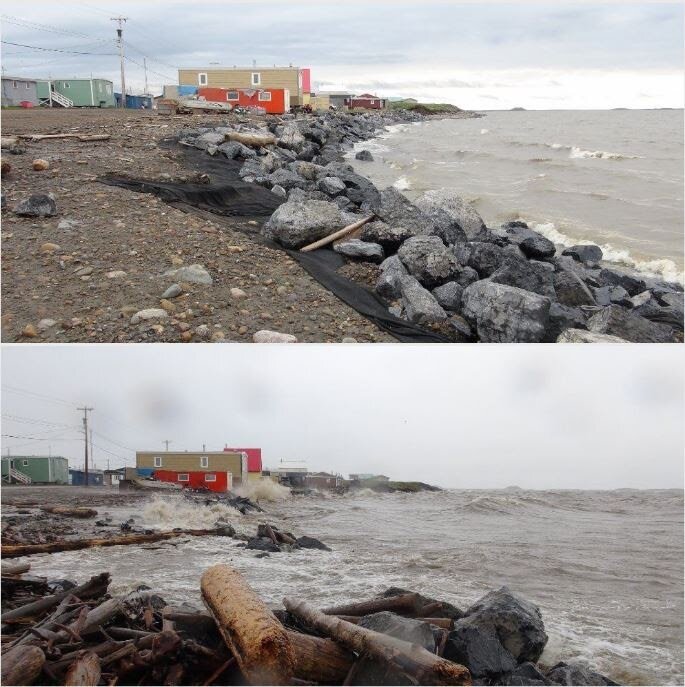
High water and wave attack on Tuktoyaktuk’s west shoreline before and during a storm (Images from NRCan, August 2000). During extreme weather events, the water can be high enough for waves to wash over the shoreline protection in place. (Images from NRCan, August 2000).
Tuk Island: A natural breakwater
One of the major controls on shoreline erosion in the Arctic, along with ground material composition and sea ice presence, is wave energy [13, 14, 15]. Waves need space to build up energy, and their impact on the coast is constrained by the open-water distance, or “fetch” [16]. Unlike the west shore of Tuktoyaktuk, which is is open to attack from waves that have had the full extent of Kugmallit Bay to grow, the community’s east shore is protected. Tuk Island spans the opening to the harbour and blocks incoming waves, and the waves hitting the community’s east shore only have a short distance to build up energy again.

Tuktoyaktuk Island shelters the inner harbour from open-ocean waves.(Photo: B. Berry, August 2019. Tuktoyaktuk, NWT).
At present, Tuk Island is eroding at an average of 1.8 meters per year, and without intervention will be breached by the year 2050 [12]. At present, the shoreline around the harbour is very slowly eroding due to slumping of thawed permafrost; if Tuk Island disappears, the harbour will be exposed to more extreme wave action, and there will be increased shoreline retreat in currently-protected areas.

Tuk Island projected shorelines. At the current annual rate of erosion, Tuk Island will be breached by the year 2050.
What’s next?
Designs for protection infrastructure to be built on the west shoreline of Tuktoyaktuk and the north shoreline of Tuk Island have been drawn with climate changes in mind. Ultimately, these structures will provide more time for the community to plan their retreat from the peninsula to safer ground.
Links / related pages
Precise Airborne LIDAR Surveying for Coastal Research and Geohazards Applications
Canadian Beaufort Sea Physical Shore-zone Analysis (1985)
Erosion progression and adaptation strategy in a northern coastal community (2003)
Past and future forcing of Beaufort Sea coastal change (2010)
Thermomechanical Erosion Modelling of Baydaratskaya Bay, Russia with COSMOS (2016)
Coastal Impacts of Climate Change: Beaufort Sea Study (1994)
Beaufort Sea coastal mapping and the development of an erosion hazard index (2003)
Coastal permafrost investigations along a rapidly eroding shoreline, Tuktoyaktuk, N.W.T. (1998)
Coastal retreat and shoreface profile variations in the Canadian Beaufort Sea (1990) (Paid)
The Arctic Coastal Dynamics Database: A New Classification Scheme and Statistics on Arctic Permafrost Coastlines (2011) (Paid)
Deterministic profile modelling of nearshore processes. Part 2. Sediment transport and beach profile development (1993) (Paid)
Quantification of Beach Changes Caused by Hurricane Floyd Along Florida's Atlantic Coast Using Airborne Laser Surveys (2005) (Paid)
References
[1]Aré. 1988. Thermal abrasion of sea coasts. Polar Geography and Geology, 12, p.1-157.
[2]Wolfe et al. 1998. Coastal permafrost investigations along a rapidly eroding shoreline, Tuktoyaktuk, N.W.T. In: Lewkowicz & Allard (eds.) Proceedings of the 7th International Conference on Permafrost, p. 1125-1131.
[3]Aveco. 1986. Shoreline erosion protection Tuktoyaktuk. Report for the Government of the Northwest Territories, Public Works and Highways.
[4] Tarin Resource Services. 2010. Aerial imagery of Tuktoyaktuk and surrounding areas.
[5] USGS / USGov. 2006. Longshore. https://commons.wikimedia.org/wiki/File:Longshore_i18n.png
[6] Baird. 2019. Tuktoyaktuk Coastal Erosion Study. Report for the Government of the Northwest Territories, Municipal and Community Affairs.
[7] Public Works Canada. 1976. Shore erosion and protection study, Tuktoyaktuk, Stage 2 Report Volume 1. Report for the Government of the Northwest Territories.
[8] UMA Engineering Ltd. 1994. Tuktoyaktuk shoreline protection studies, phases ii and iii, interim report no. 2. Report for the Government of the Northwest Territories, Department of Municipal and Community Affairs.
[9] Solomon & Covill. 1995. Impacts of the September 1993 storm of the Beaufort Sea. In: Proceedings of the 1995 Canadian Coastal Conference, Vol. 2
[10] Solomon. 2001. Tuktoyaktuk risk assessment 2001. Appendix A of Hamlet of Tuktoyaktuk Shoreline Erosion Progression and Community Impact Study (UMA 2002).
[11] Trillium Engineering and Hydrographics Inc. 1997. Tuktoyaktuk erosion control using monolithic concrete slabs. Prepared for Hamlet of Tuktoyaktuk.
[12] Baird. 2021. Tuktoyaktuk Erosion Mitigation. Report for the Hamlet of Tuktoyaktuk and the Inuvialuit Regional Corporation.
[13] Barnhart et al. 2014. The effect of changing sea ice on physical vulnerability of Arctic coasts. The Cryosphere, 9. doi: 10.5194/tc-8-1777-2014
[14] Dallimore et al. 1996. Deep-seated creep of massive ground ice, Tuktoyaktuk, NWT, Canada. Permafrost and Periglacial Processes, 7, pp. 337-347.
[15] Héquette & Barnes. 1990. Coastal retreat and shoreface profile variations in the Canadian Beaufort Sea. Marine Geology. 91. doi: 10.1016/0025-3227(90)90136-8
[16] Thomson & Rogers. 2014. Swell and sea in the emerging Arctic Ocean. Geophysical Research Letters. doi: 10.1002/2014GL059983